18. Matplotlib Example
Matplotlib Example
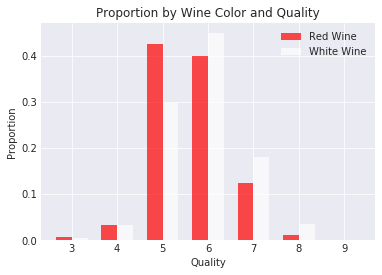
Below is the Type and Quality Plot created with Matplotlib. As you can see, Matplotlib gives us much more control over our visualizations.
Before we jump into the making of this plot, let's walk through a simple example using Matplotlib to create a bar chart. We can use pyplot's bar function for this.
Workspace
This section contains either a workspace (it can be a Jupyter Notebook workspace or an online code editor work space, etc.) and it cannot be automatically downloaded to be generated here. Please access the classroom with your account and manually download the workspace to your local machine. Note that for some courses, Udacity upload the workspace files onto https://github.com/udacity , so you may be able to download them there.
Workspace Information:
- Default file path:
- Workspace type: jupyter
- Opened files (when workspace is loaded): n/a